Use iperf to measure the throughput over NS3 networks and dynamically plot the throughput with gnuplot
[topology]
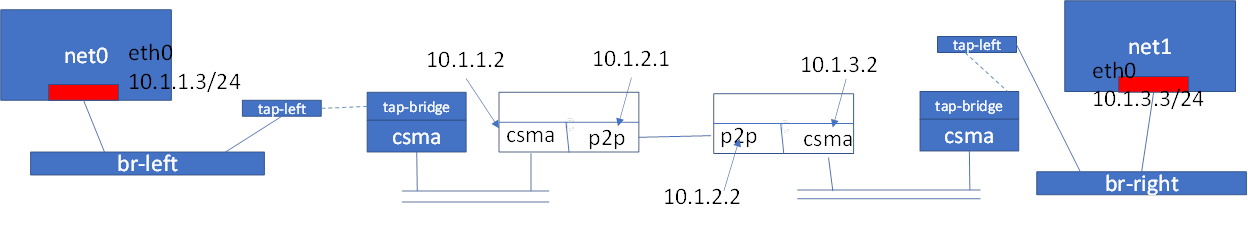
Read https://nqucsie.myqnapcloud.com/smallko/ns3/ns3-usebridge.htm and https://nqucsie.myqnapcloud.com/smallko/ns3/ns3-ffmpeg.htm first to know how to set up the network topology.
process.sh
|
filename='/home/user/ns-3-allinone/ns-3.34/a' > /home/user/ns-3-allinone/ns-3.34/result > /home/user/ns-3-allinone/ns-3.34/a b="not" while true do if [ -s "$filename" ] then #echo "$filename is NOT empty file." while IFS= read -r line do result=`echo "$line" | grep "sec"` if [[ -n $result ]] then #echo $result b="done" break fi done < a fi
if [ $b = "done" ] then break fi done
while IFS= read -r line do result=`echo "$line" | grep "sec" | tr "-" " " | awk '{print $4,$8}'` if [[ -n $result ]] then echo $result echo $result >> result sleep 1 fi done < a |
gnuplot-plot
|
FILE = 'result' stop = 0
N = 50 set yrange [0:5] set ytics 0,0.5,5 set key off set xlabel "time(sec)" set ylabel "Throughput(Mbps)"
while (!stop) { pause 0.05 # pause in seconds stats [*:*][*:*] FILE u 0 nooutput lPnts=STATS_records<N ? 0: STATS_records-N plot FILE u 1:2 every ::lPnts w lp pt 7 } |
plot-throughput.sh
|
filename='/home/user/ns-3-allinone/ns-3.34/result' while true do if [ -s "$filename" ] then #echo "$filename is NOT empty file." break fi done
gnuplot gnuplot-plot |
Execution

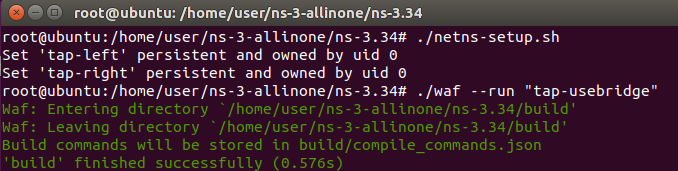
Open another terminal
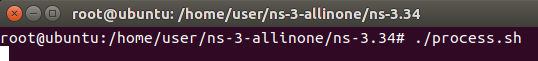
Open another terminal

Open another terminal
![]()
Open another terminal
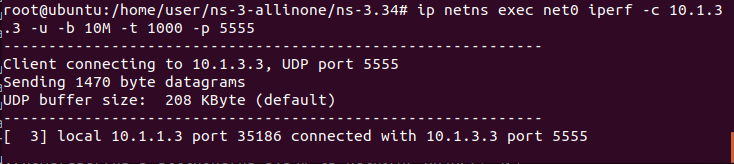
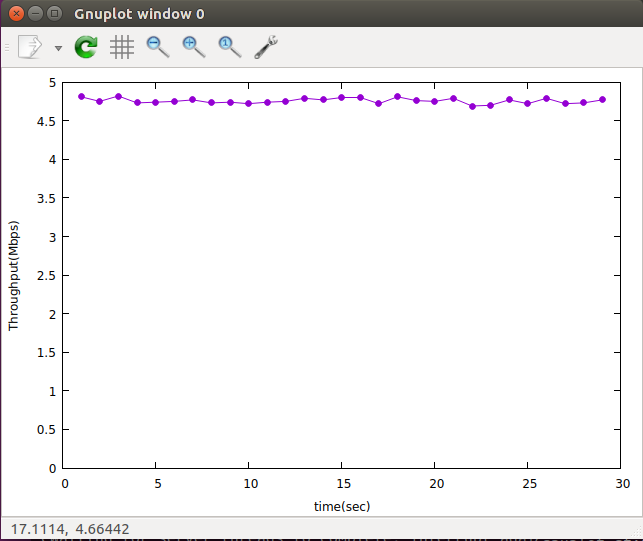
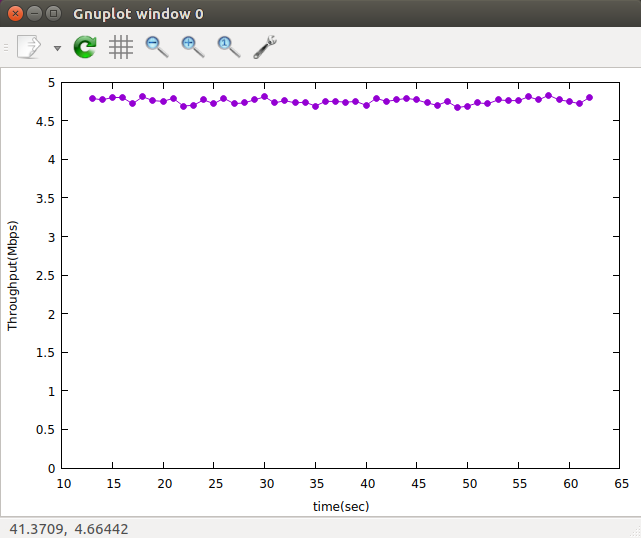
And you can see
Last
Modified: 2022/2/27 done
[Author]
Dr. Chih-Heng Ke
Department of Computer Science and
Information Engineering, National Quemoy University, Kinmen, Taiwan
Email: smallko@gmail.com