How to use iperf over mininet ?
[Description]
In this lab, I will show how to use iperf to do basic performance evaluation over mininet. Also, I will use simple shell script to get the evaluation results and then use gnuplot to draw the graph.
[Operations].
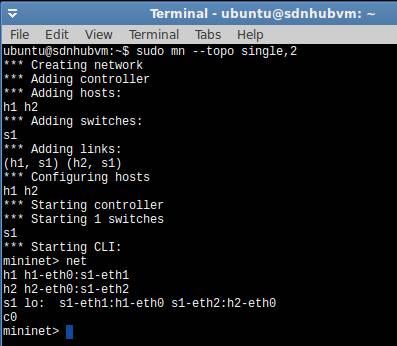
1. Create one switch and two hosts environment.
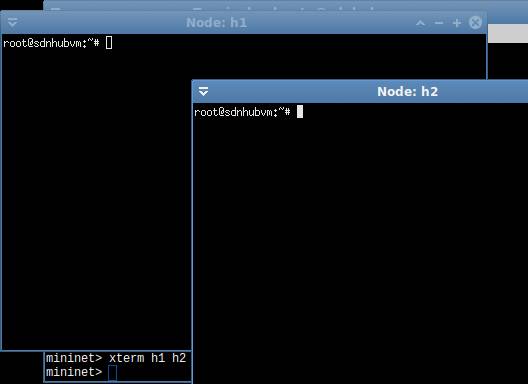
2. use xterm to open windows for h1 and h2
3. Basic TCP transmission evaluation.
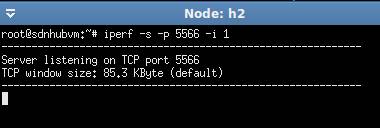
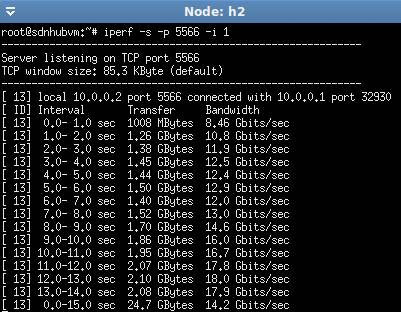
3.1 Start the TCP server (-s) at h2 with port 5566 (-p). Also, monitor the results every one second (-i). Note: the default setting is using TCP.
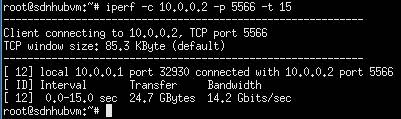
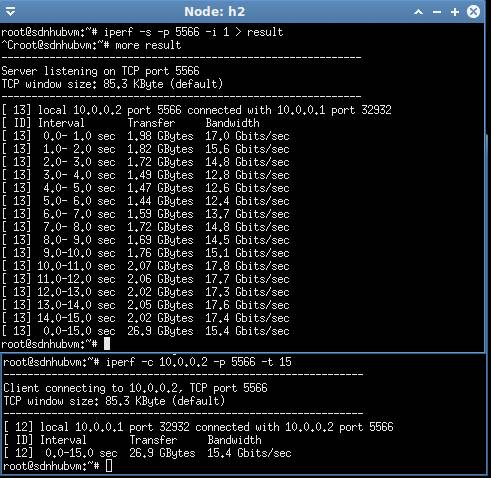
3.2 Start the TCP client (-c) at h1. Also, set the transmission duration (-t) to 15 seconds. Note: after -c, you need to specify the server ip address.
![]()
3.3. Results.
results at h1. (From 0~15 seconds, the average throughput is 14.2 Gbps)
results at h2. (The following figure shows the throughput every second)
3.4 If we want to draw the throughput graph, we need to do the evaluation again. But this time, we need to save the result into a file. Then do some post-processing. After that, use gnuplot to draw the graph.
3.4.1 start the iperf server again. (use > to redirect the results to "result" file)
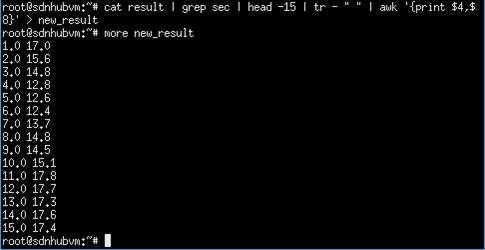
3.5. do the post-processing to get the data for plotting. (| grep sec: reserve the line containing "sec"; head -15: from beginning, get the first 15 lines(1~15 seconds); tr - " ": using " " to replace "-"; awk '{print $4, $8}: get the 4th and 8th columns)
The final results: the first column is time, and the second column is throughput.
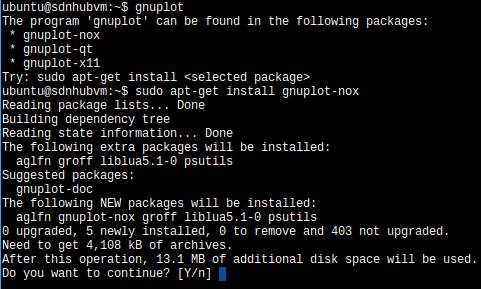
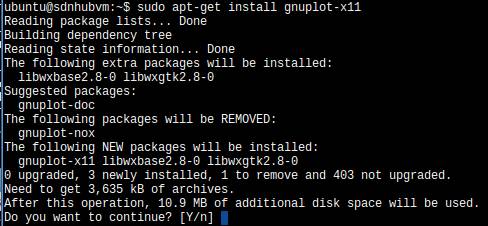
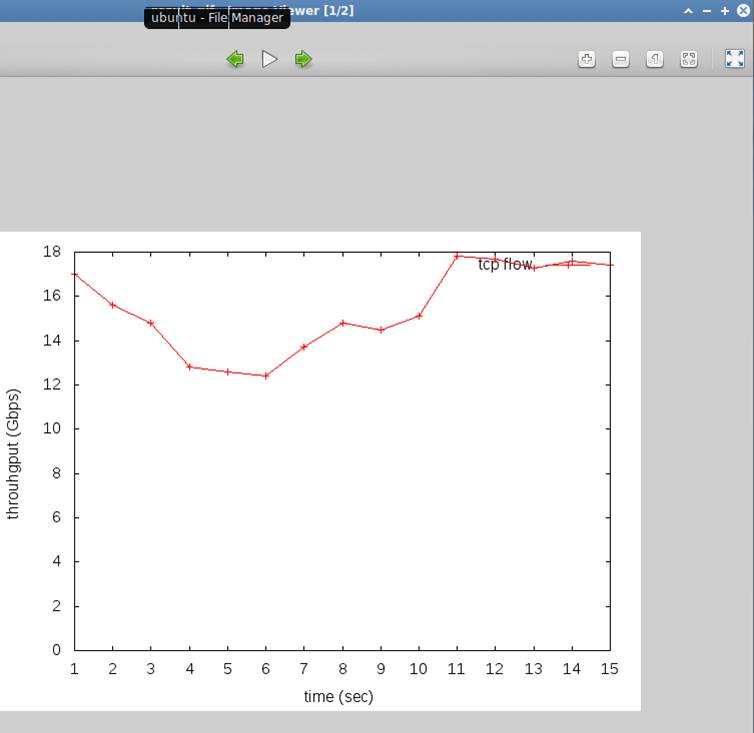
3.6 use gnuplot to draw the graph. (Install gnuplot if needed)
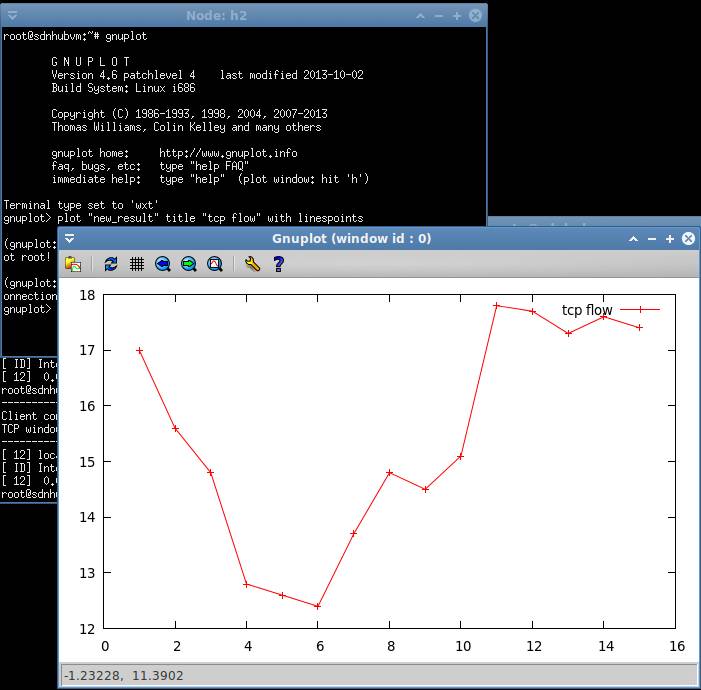
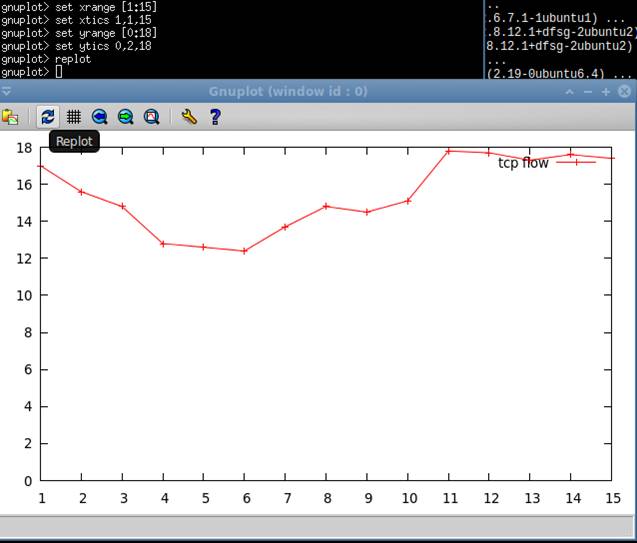
start gnuplot. [plot "new_result" title "tcp flow" with linespoints"] is draw the graph using data in new_result file.
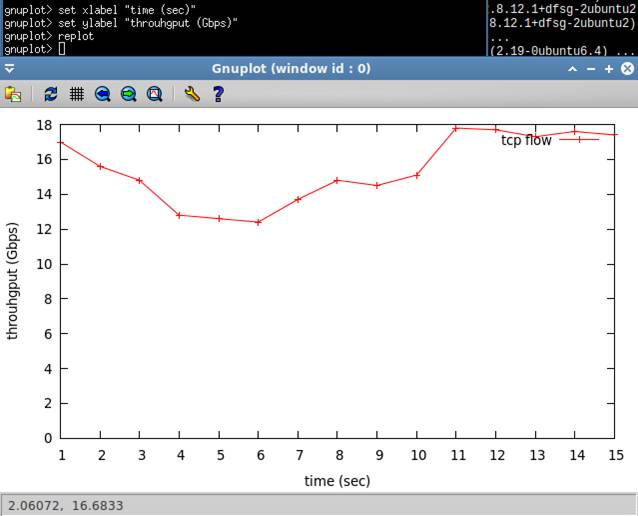
save the graph into result.gif
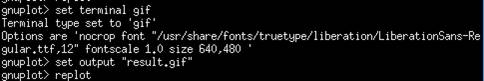
exit the gnuplot program.
![]()
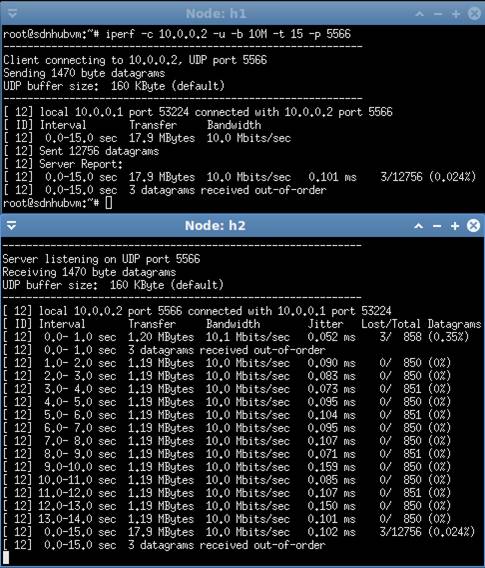
4. Basic UDP transmission evaluation.
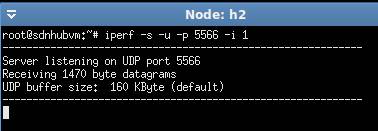
4.1 Start the UDP (-u) server (-s) at h2 with port 5566 (-p). Also, monitor the results every one second (-i).
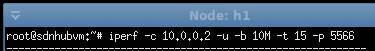
4.2 Start the UDP (-u) client (-c) at h1. Also, set the transmission duration (-t) to 15 seconds. Note: after -c, you need to specify the server ip address. Also, you can use -b to specify the sending rate.
4.3 Results.
4.4 use similar shell script to get the data and draw the figure. (Please do it by yourself.)
Dr. Chih-Heng Ke
Department of Computer Science and Information Engineering, National Quemoy University, Kinmen, Taiwan
Email: smallko@gmail.com